When working with a typical vector graphics library, you will get functions, or classes, to draw lines circles, squares and other basic shapes, combined with text and fonts etc.
In SVG, this is provided as different xml strings. The rendering is done by the interpreter of the SVG strings when the svg image is read. The interpreter in this case will be the web browser, in case of the diagrams in the documentation. Another good program to edit SVG is Inkscape, which uses the SVG format as its native graphics format. This program can also be used to inspect the SVG xml structure.
So, to create SVG output, we need to represent and create xml string graphics primitives.
Also, to create more complex graphics structures from graphics primitives, we need something to represent the objects that you want to draw that can be easily worked with and manipulated in c++. These will be small classes which can be put in std:: containers of various kinds, i.e. maps, vectors and lists.
In Shrubbery Designer, these primitive graphics classes will be used inside linked lists and other container structures to both visualise the structure for the developer and to create the end output diagrams, or whatever graphics you want to create.
The graphics classes in SVGX represent three things: points, areas, and vectors.
As it turns out, these object types are enough to create the layout of almost all diagrams we might need, because most symmetry in most diagram types is based on rectangular areas, and sometimes angles. So even if you need a circle or an ellipse, it would typically be contained inside a rectangular area in the layout, and maybe be aligned with some other area. Even though it is a circle, the rectangular area will usually work fine for creating the aignment. And when the layout has been calculated, the basic area classes can be rendered with ellipses circles, rectangles, colors and style options like line width and transparency.
Operators:
Often when working with these primitive graphics classes there will be a lot of code lines that are repeated for the x and y coordinates. This can make the code cluttered and harder to read. SVGX make use of c++ operator overloading on the point, area and vector classes to make the code cleaner and more abstract.
A basic example is the += operator, for instance, for a point representation.
Instead of writing:
everywhere in the code, it is much neater to write:
And pretty intuitive.
Then you can extend that to work with all basic arithmetic operators. And of course, area objects can be made to work the same way:
The advantage is that you make the code briefer and you can reduce clutter. You do need to understand the definition of the operations of course, like adding two areas means adding the two points that define the areas, which in turns means adding the x coordinate of point one to the x coordinate of the other point, and the corresponding operation for the y coordinates.
You could use functions instead, and that is also done, but using operators makes the code more sparse and equation like. It also encourages breaking down layout problems into standardised operations instead of making all calculations differently for each instance of use. That way, if a problem is found, you can usually fix it in one location.
Arithemtic operations are pretty straight forward. The concept is also extended to use some of the remaining operators to define commonly recurring operations. They may seem a bit less intuitive, but I find that once you have grasped their definitions, they can be convenient to work with. And when you get the hang of them, the code will be easier to read.
For instance the code for calculating the area required to cover two arbitrary areas looks like this:
By defining the | operation for this, we can instead write:
The use of the special operators are explained in more detail in the following sections.
Putting it together:
When the layout is calculated and ready, the basic graphics objects are used in SVGX together with macro like functions to create SVG xml strings. These can be stored and manipulated, or used directly as output to create svg files.
Putting it together we get a method for adding relatively sophisticated graphics output to a program that is small, or needs to run in smaller circumstances, which is exactly what we need for Shrubbery Designer.
Since SVG is basically a command language for your rendering backend, which is a completely separate program, usually your web browser, the frontend can be relatively light weight and the browser made to to the grunt work.
And being SVG means that the output from Shrubbery Designer should be possible to further filter, or combine with another svg image, such as a template, or background, to create some finished image.
SVG will not be explained here. There are lots of great tutorials, examples and documentation on the web. There are also some excellent books that explain all the details.
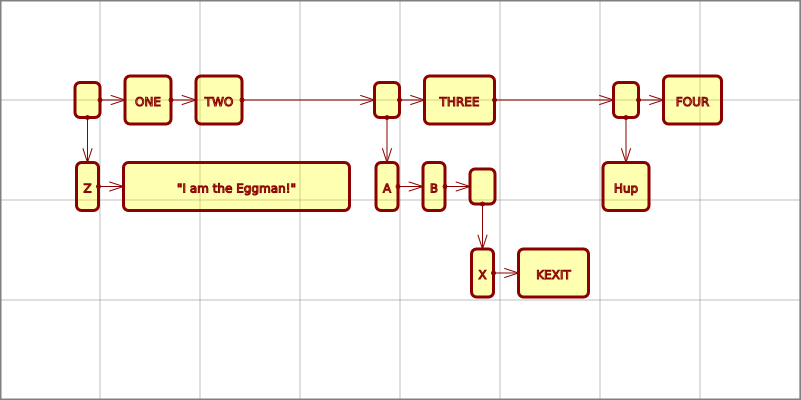
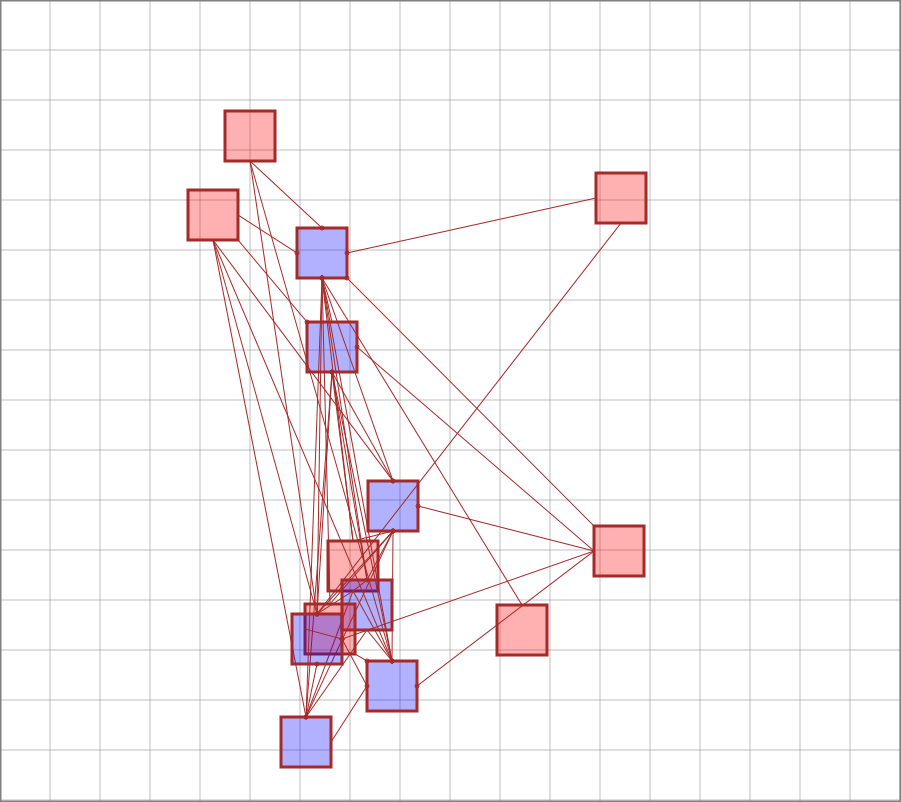
Below is an example of basic layout and rendering of a Shrubbery Designer linked list. It is drawn from left to right and uses a simple layout scheme to avoid that nodes overlap. As we will see, there are many other ways to draw diagrams using graphic primitives stored in a single linked lists.
The basic shapes used in svgx are points, areas and vectors as defined by the classes gx_TPoint, gx_TArea and gx_TVector.
gx_TPoint is the basic template class to define a point. The basic point is made up of only x,y and a bunch of operators.
If we don't show the operators it looks like this:
The operators are added so we can operate on points without writing expressions for the x and the y parts. This makes expressions simpler and the code easier to read and understand.
The template is added to be able to use different types without having to duplicate all the operators. Sometimes you want to use int as the data type, like when working with ncurses.
[Point typedefs] gx_TArea is the basic template class to define an area using type T.
An area is made up of 2 points p1<T>,p2<T>. and, just like for gx_TPoint, a bunch of operators.
If we don't show the operators it looks like this:
We then add operators to do things with the areas, like adding, subtracting multiplying etc. There are also some special operators define useful and frequently needed graphics operations, like determining the overlapping area of two areas, or the area needed to make a new area covering two areas and all the space in between.
Since the two types that you would be interested in using are int and double, typedefs are added to create a more convenient form for those types.
Typedefs for points:
Typedefs for Area types
The SVG drawing functions are defined with gx_dPoint and gx_dArea as parameters. For nucrses functions, the gx_iPoint and gx_iArea types would be used instead.
It turns out that for most diagram drawing and similar, you can usually operate with square definitions of the area a shape is drawn in, and or vectors of points. This is how most drawing applications do it also, so it is pretty natural.
When you render the image, or create the svg drawing, you can then fill the square areas with circles and ellipses, add colors etc.
The gx_Point and gx_Area objects are used for creating alignment and calculating placement of the shapes that will make up the final drawing.
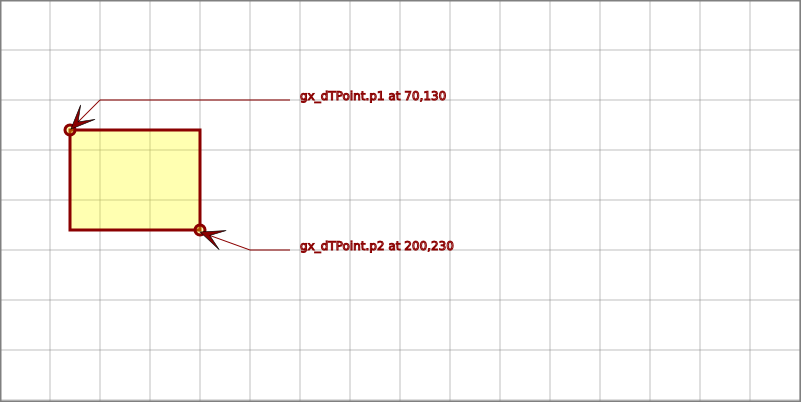
For instance, the code for this simple drawing, with two points and one area:
would look like this:
As you can see, the code snippet starts with opening the svg file that is produced. It is used for writing the svg objects using the standard ofstream << operator.
Before the drawing can start, the beginSVG function must be called.
The beginSVG Functions creates the header needed for an SVG file.
This function produces some xml code like this:
Before the svg file is closed you also need to call the endSVG function. the endSVG closes the svg tag for the whole svg file.
Like this:
In this example the styles are supplied to the functions as hardcoded strings for the points and the area. There are also some defines in svgx.h that are used for the tests and examples. Doing it this way is simple and can often be adequate, since you usually want one consistent style for most of the figures in a document. But one usually finds that it takes a lot of tinkering to get the colors and lines to look the way you want, so having one define is better than copy pasting.
The actual svg format strings are a bit hairy, and not so uniform and consistent as a c++ programmer might whish. It is not quite as simple and uniform as to precisely fit the svgx graphics objects at least. To create the translation, a sort of macro string function is used, somewhat similar to printf, for creating the xml / svg strings.
To translate gx object properties to SVG xml strings the gx_expandSVG template function is used.
The gx_expandSVG is a macro like function which expands a string into an SVG representation.
| gx_Obj | Object to extract parameters from. Must support the [string] parameter for the parameter. |
| iStrep | The string template for creating the SVG xml string. |
| Pass | Set true to pass the string through unexpande. |
| Expanded | SVG xml string. |
The gx_expandSVG takes a string like:
together with an object like gx_TPoint<T> or gx_TArea<T> and fills in the values for the parameters of the object in place of the variables following the @. In the above example the x parameter and y parameter would be filled in, in place of @x and @y.
For the substitution to work, the gx_Obj must support the parameter string name for the [string] operator. If the parameter can not be found, an exception will be thrown.
The Pass parameter can be used when you want to get the macro unexpanded. This can be useful when retrieving the macro from e.g. gx_drawSVGCircle to save it or combine it with other shapes.
The drawing functions for lines, rounded rectangles, circles etc, all make use of the gx_expandSVG function to create the SVG xml string to draw the desired shape. They are not really necessary, you could use the gx_expandSVG function directly, but then you would need to remember the exact format of the string to use. The drawing functions can be seen as a way to remember and encode the SVG strings, and also, they make the code cleaner.
However, the SVG standard is pretty huge, so you will probably at some point want to roll your own drawing functions. Looking at the ones already defined, this should be pretty straight forward.
Additionaly, the drawing functions are made so that the style part can be added separately as a string, i.e. colors, line with, filling etc.
Because there are many parameters and variations, it is useful to be able to simply write these parameters in as text.
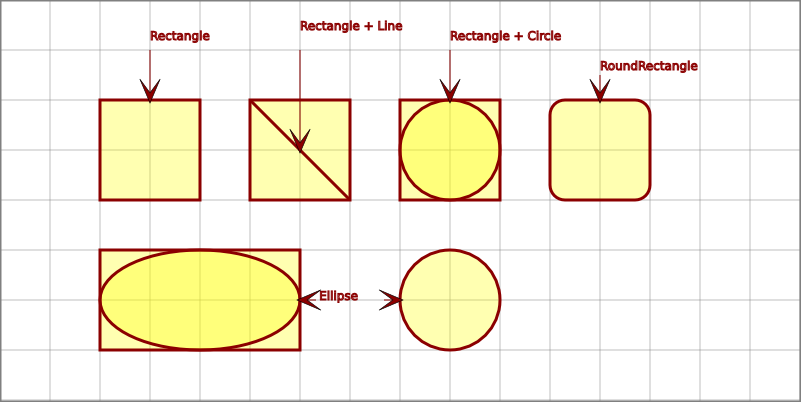
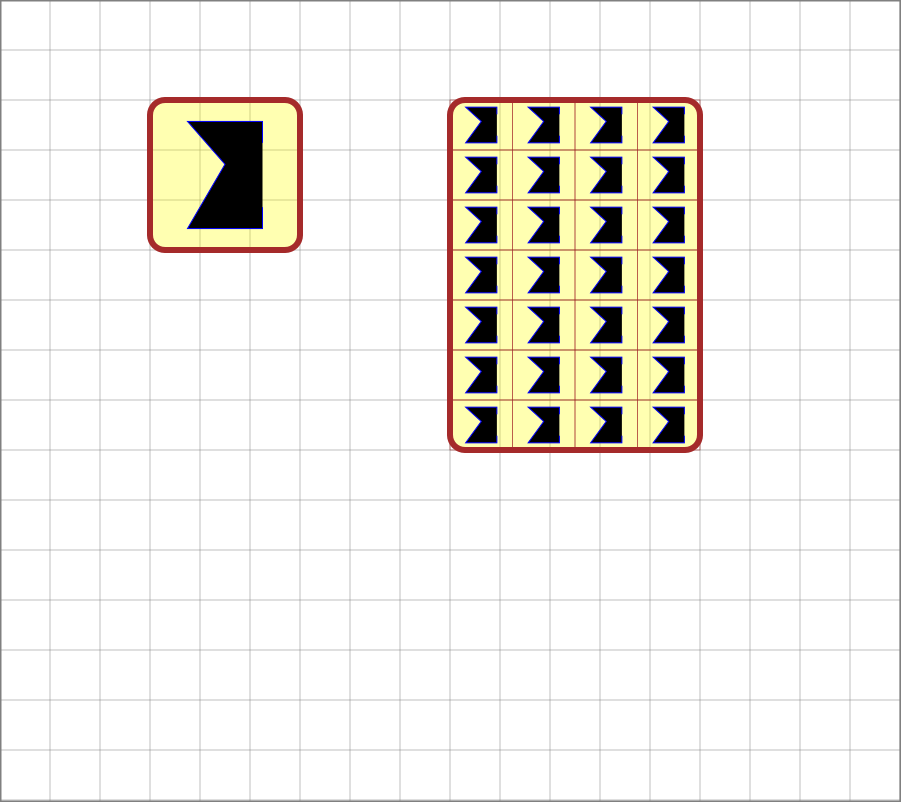
Above are some sample drawings of the basic shapes in svgx. The code snippet below shows how the predefined drawing functions are used to produce the SVG xml strings. It also shows examples of using the special operators. See subsequent sections for more details on how they work.

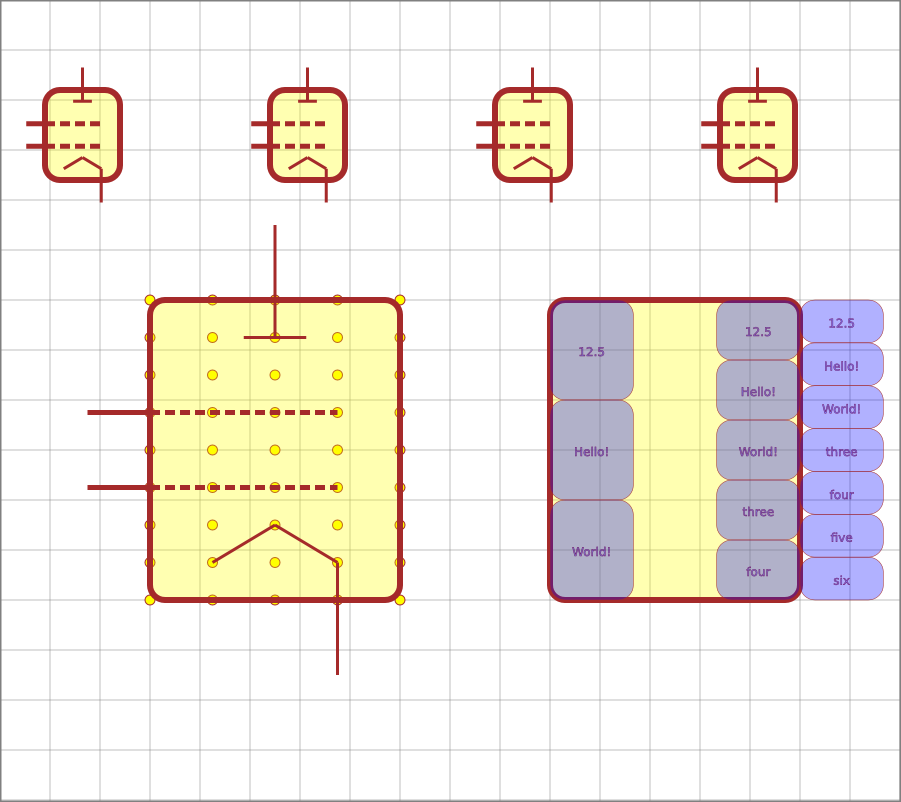
In addition to the points p1 and p2 of an area, there are functions in the gx_TArea class that can be used to determine the height and width of the area, and also the diaonal.
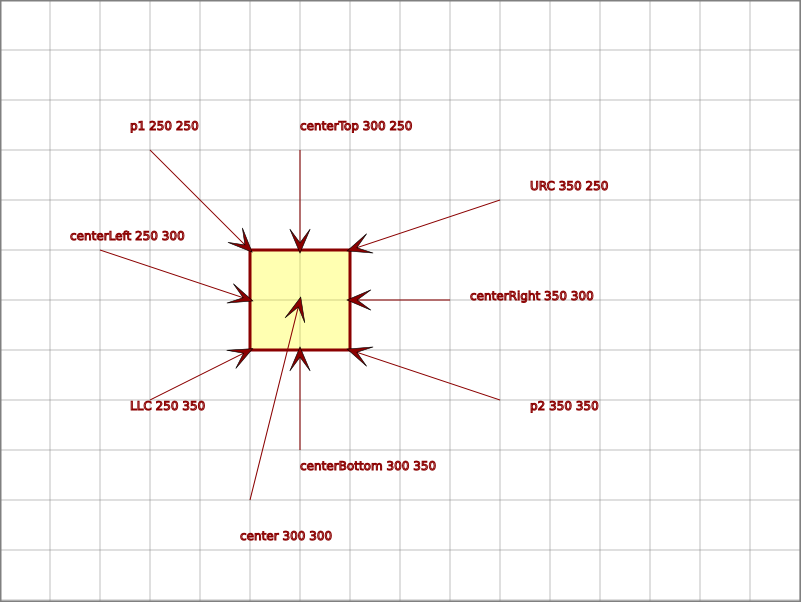
In addition to area measures like width and height, the gx_TArea class also provides marker points that are useful when drawing diagrams. They provide the location, in the form of a gx_TPoint, when you need to connect to the left center point of an area, the center, upper right corner etc. The figure above shows the location of the marker points.
Using these markers you can also easily calculate other points like a quarter center left point. See also the sub matrix function, if you need more points to work with on an area.
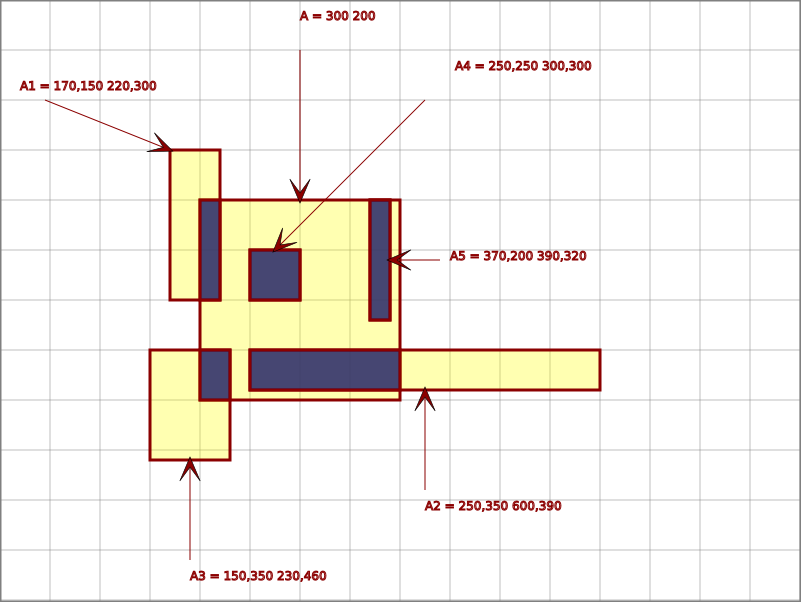
The & operator can be used to calculate the overlapping portion of two areas. This is a somewhat logical analogy with how the & operator works with bolean or binary values. It will give you the area that the two operands have in common.
In the figure above the overlapping parts of the area A and the partially overlapping areas called A1,A2 etc. are drawn. The code to do this is rather compact. It looks like this (with the code to draw the labels removed):
This code is repeated for A2,A3... etc.
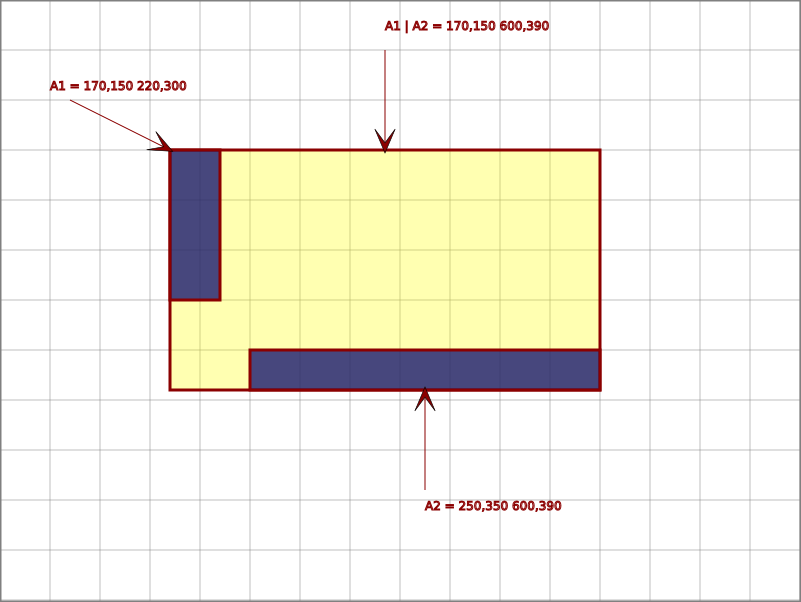
Similarly in analogy to the & operator, the | operator is used to calculate the area covered by the operand areas, or more accurately, the rectangular area that would be required to cover both areas.
The code might look like this:
This operator is useful when working on groups of graph items. If you would like to draw a frame around a group of items for instance, or align one group of items next to another group.
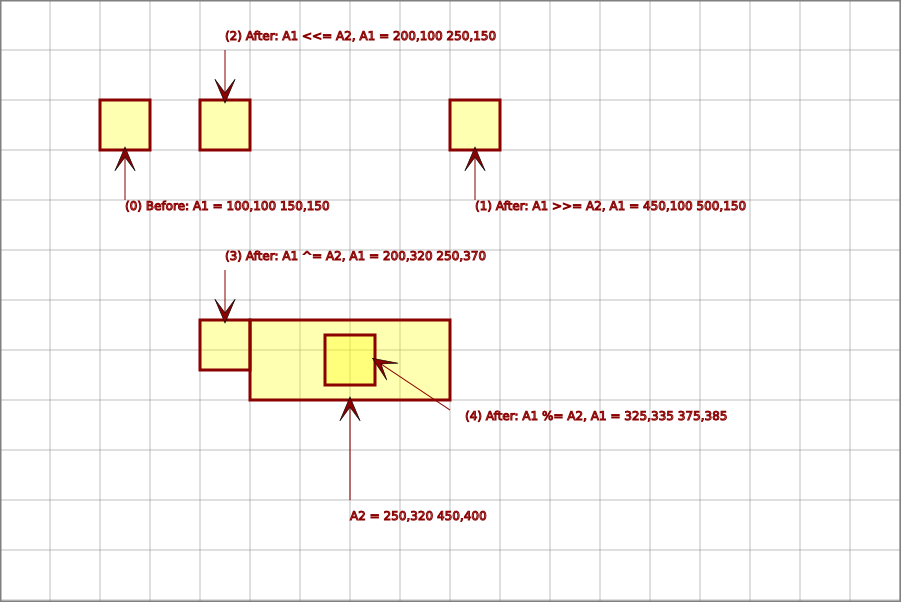
The aligment operators are uses to align areas to other areas or points. They are convenient shortcuts to align areas horisontally, or vertically, or to the center of an area.
The >>= operator aligns an area with the right edge of the operand, shifting it to the righthand position, you may say. It does not affect the y position of the area. Typically, you would first align the area with the edge of the other area and then add a margin, in the form of an area, point or constant.
The <<= does the same thing, but aligns the area to the left edge of the operand.
The ^= operator aligns the upper edge of the operand with the upper edge of the area, i.e. it aligns the areas in the vertical direction.
Finally, the %= operator moves the operand area to the center of the area.
Combining >>= and ^=, is typically used to put areas in line horisontally.
You can use the %= operator to center two areas and then add an offset in y direction for drawing something like, for instance, the text boxes of a flow chart.
[Area typedefs] gx_TVector is used for calculation involving angles and distances. It is useful for instance when drawing arrows and connections, rotations etc. It is as an aid to make calculations of points and is not used directly as input to drawing functions.
Cast operators to gx_TArea<T> and gx_TPoint<T> are provided for convenient conversion to points and areas that can be used directly by drawing functions.
Without operators it looks like this:
v represents the angle of the vector and len the length. Using the constructors you can create the vector representation from an angle and a lenght, or from two points, or an area, in which case the width and height of the area are used to calculate length and angle.
Typically you would have two points that you want to get the angle between and then modify or use the angle. An example would be drawing an arrow between two arbitrary points in any qudrant.
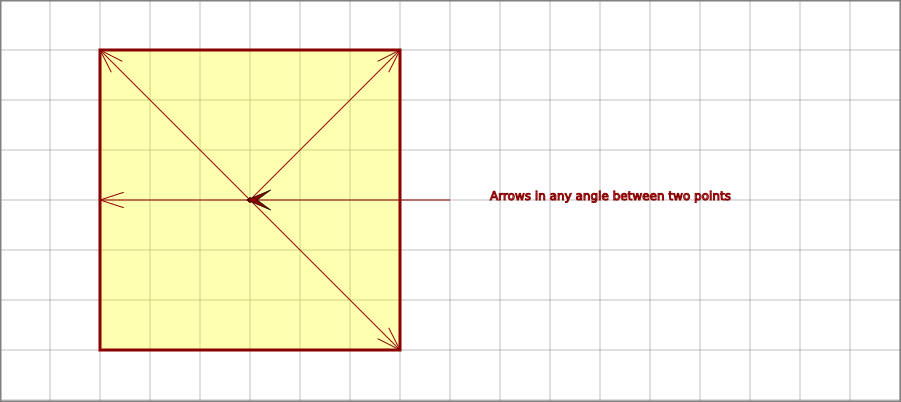
Since the routinge to draw the arrow needs to work in any guadrant, it is nice to be able to work with angles when working out how to draw the arrow head.
You might do it like this:
Of course there are other ways of drawing arrows with svg, which have been used for the text labels in the drawings. The drawArrow function is included more to demonstrate the use of vectors. Or it can be used for very large arrows, or for drawing your own special type arrows.
Another use for vectors can be to do circular patterns. You can create a circular figure or pattern by using a gx_TVector and increasing the angle of what you are drawing until it completes a full circle.
Typical examples would be a clock, or a clock face, stars, and of course the old fractal star thingy which is created by recursively splitting the lines into smaller star patterns.
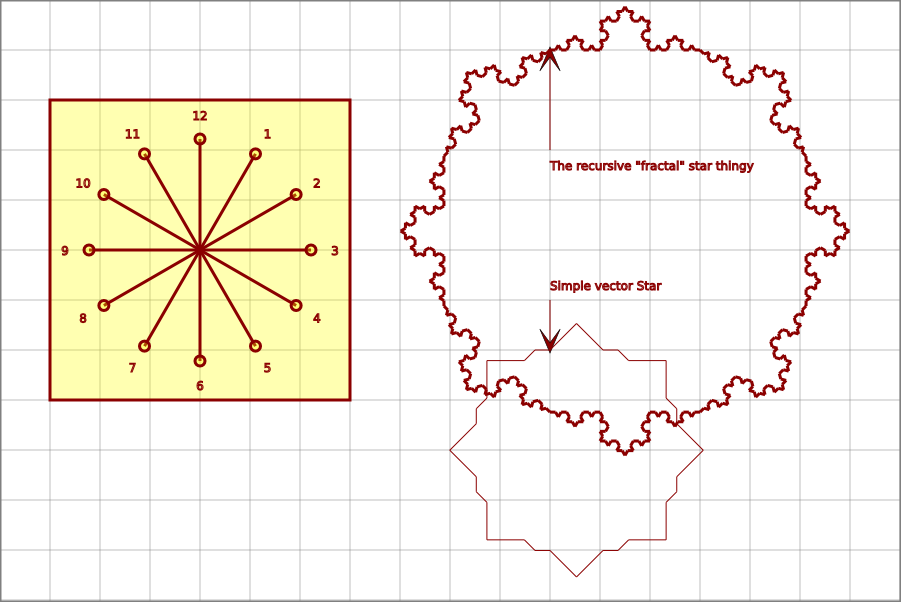
The fractal star thingy function is implemented like this:
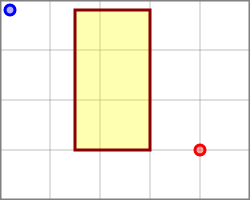
A useful function on the way to being able to create layouts for connecting boxes is the closest point function. It conveniently calculates which points is closest on the closest side of an area. In the figure above this is illustrates by drawing an arrow from a point that is rotated around a rectangle.
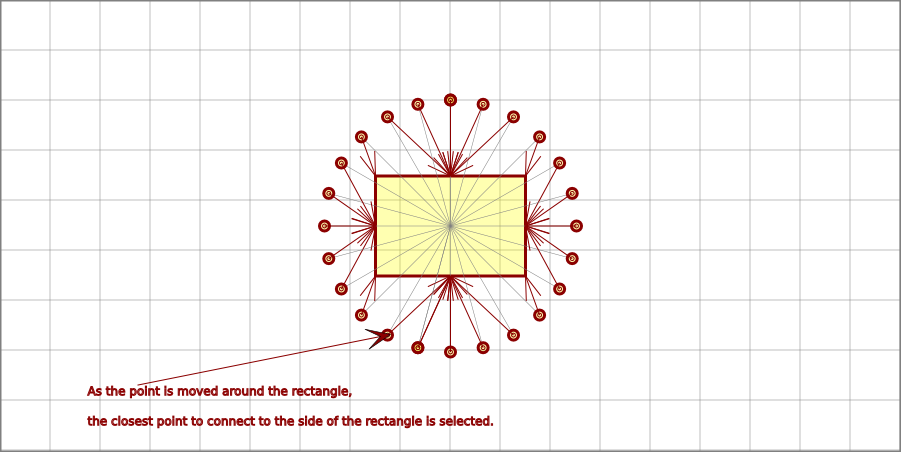
To draw the arrow, all you need is this code line:


With the gx_TContainer class you can create a vector of gx_T type objects, i.e. gx_TArea, gx_TPoint etc. In your macro string you can then reference the elements of the vector with a number.
So if you have a vector of gx_TPoint<double>, a.k.a gx_dPoint, you could reference x of the second element with
@1.x (Index starts at 0 as with normal std::vector)
This code shows and example of how a path in svg could be created:
You can also use operators on whole containers to move and align them as complete objects. For instance, say we want to move the previous line pattern a bit and draw it as a curverd path.
Of course there is a function for drawing line paths that could be used instead. The previous example is suitable for rolling your own svg paths. It gets tedious to use though if you wanted to add some more points to the staircase pattern. The gx_drawLinePath function may be more convenient.
This will result in the olive colored staircase pattern in the figure above.


When a test is run it creates an image with code like this:
The image thus produced can then be referenced somewhere in the documentation together with some more explaining text.

helper:

(c) 2012, Peter Soderholm
All rights reserved. Redistribution and use in source and binary forms, with or without modification, are permitted provided that the following conditions are met:
THIS SOFTWARE IS PROVIDED BY THE COPYRIGHT HOLDERS AND CONTRIBUTORS "AS IS" AND ANY EXPRESS OR IMPLIED WARRANTIES, INCLUDING, BUT NOT LIMITED TO, THE IMPLIED WARRANTIES OF MERCHANTABILITY AND FITNESS FOR A PARTICULAR PURPOSE ARE DISCLAIMED. IN NO EVENT SHALL THE COPYRIGHT HOLDER BE LIABLE FOR ANY DIRECT, INDIRECT, INCIDENTAL, SPECIAL, EXEMPLARY, OR CONSEQUENTIAL DAMAGES (INCLUDING, BUT NOT LIMITED TO, PROCUREMENT OF SUBSTITUTE GOODS OR SERVICES; LOSS OF USE, DATA, OR PROFITS; OR BUSINESS INTERRUPTION) HOWEVER CAUSED AND ON ANY THEORY OF LIABILITY, WHETHER IN CONTRACT, STRICT LIABILITY, OR TORT (INCLUDING NEGLIGENCE OR OTHERWISE) ARISING IN ANY WAY OUT OF THE USE OF THIS SOFTWARE, EVEN IF ADVISED OF THE POSSIBILITY OF SUCH DAMAGE.
 1.8.6
1.8.6 
